How to Build a Warren Buffett Stock Filter in Python through Distillation


From our last post, we experienced the power of distilled models: saving time, leveraging knowledge learned from mature models, and generating decent outputs. What if we apply the exact same concept to investment planning?
I wanted to build a stock-screening strategy focused on high-quality value stocks without spending 40 hours a week sifting through financial statements. But every time I ran a standard stock screener, I was left drowning in thousands of companies, unsure of which ones actually had a sustainable competitive advantage.
It’s an overwhelming wall to hit. You want to pick solid stocks, but you don't have an army of analysts to run deep-dive due diligence on every balance sheet.
This is where the distilled model concept comes into play. You don’t need an army of analysts to filter high-quality stock candidates, you just need to distill your search space using the giant who already spent millions doing that work: Berkshire Hathaway.
From Concept to Reality
Think of this strategy like Model Distillation in Machine Learning.
When training a massive LLM (like a 200B+ parameter "teacher" model), it swallows nearly the entire internet, uses a city’s worth of compute power, and distills that intelligence into a lean, fast 8B "student" model. The student model doesn't need to re-learn the entire internet from scratch, it simply learns to mimic the high-value reasoning distilled by the teacher.
In stock market terms:
- The Teacher Model: Berkshire Hathaway's research team. They spend months evaluating economic moats, executive management, and debt structures.
- The Model Distillation: The ~40 stocks disclosed in Berkshire’s quarterly 13F filing – a report required by the U.S. Securities and Exchange Commission (SEC) to show where major funds invest.
- The Student Model: Our trading pipeline. Instead of analyzing 4,000+ U.S. stocks, we restrict our decision-making pool strictly to Berkshire's pre-screened portfolio, using Python to spot quarter-over-quarter buys, sells, and hold changes.
+-------------------------------------------------------------+
|               TEACHER MODEL (Berkshire)                     |
|  Massive Analyst Teams + Decades of Due Diligence           |
+-------------------------------------------------------------+
                               |
                               | (Distillation via 13F Filings)
                               v
+-------------------------------------------------------------+
|               STUDENT MODEL (Our Python Script)             |
|  Distilled Universe (30–40 stocks) -> Custom Trade Decision |
+-------------------------------------------------------------+
It's Clob Coding Time!
As always, CodeAStar will use avaiable tools to minimize effort and bring the greatest return. Let' start our coding with the uv tool like last time.
(You can also find the full source code on GitHub.)
uv bplus_investor
cd bplus_investor
uv add python-dotenv edgartools
Edgartools is a powerful library that helps us getting public data from the SEC. We will need 2 key settings for our program:
- Central Index Key (CIK): A unique identification number assigned by the SEC to track corporate filings. In our case, we are querying Berkshire Hathaway's filings (
0001067983). - Your Identity: This is a regularation requested by the SEC. The SEC requires all programmatic API traffic to self-identify via a custom User-Agent string. If a script or application attempts to fetch EDGAR data without this identifier, the SEC servers will automatically deny the request and block the connection.
Therefore we have our .env file with:
CIK=0001067983  # Berkshire Hathaway CIK
IDENTITY_EMAIL=your email address
And we edit the main.py with the following code:
from email.mime import message
import os, math
from dotenv import load_dotenv
from edgar import Company, set_identity

def format_human_number(value):
    if math.isnan(value): return ""
    val, abs_val = float(value), abs(value)
    if abs_val < 1000: return f"{val:,.2f}"
    idx = min(int(math.log10(abs_val) // 3), 3)
    return f"{val / (10 ** (idx * 3)):.2f}{['', 'K', 'M', 'B'][idx]}"

def display_holdings_changes(changes_df, message, cols_present):
   if not changes_df.empty:
     print(message)
     print(changes_df[cols_present].to_string(index=False))
     print()

load_dotenv()
set_identity(os.getenv("IDENTITY_EMAIL"))
the_company = Company(os.getenv("CIK"))
filings = the_company.get_filings(form="13F-HR")
current_13f = filings[0].obj()   # Most recent quarter
previous_13f = filings[1].obj()  # Prior quarter
df = current_13f.holdings.rename(columns={"SharesPrnAmount": "Shares"})
total_value = df["Value"].sum()
df["Weight (%)"] = (df["Value"] / total_value * 100).round(2)

print("Current holdings:")
current_holdings = df[["Ticker", "Issuer", "Value", "Shares", "Weight (%)"]].assign(
    Shares=lambda d: d["Shares"].map(format_human_number),
    Value=lambda d: d["Value"].map(format_human_number).apply(lambda x: f"${x}" if x else "")
)
print(current_holdings)
print("\n" + "="*50 + "\n")

print(f"Comparing [{previous_13f.report_period}] vs [{current_13f.report_period}]")
changes = current_13f.compare_holdings(previous_13f)
df = changes.data.assign(
    PrevShares=lambda d: d["PrevShares"].map(format_human_number),
    ShareChange=lambda d: d["ShareChange"].map(format_human_number),
    ShareChangePct=lambda d: d["ShareChangePct"].map(format_human_number).apply(lambda x: f"{x}%" if x else ""),
    Value=lambda d: d["Value"].map(format_human_number).apply(lambda x: f"${x}" if x else ""),
    Shares=lambda d: d["Shares"].map(format_human_number),)
display_holdings_changes(df[df['Status'].str.upper() == 'NEW'].copy(), "--- NEW POSITIONS BOUGHT ---", ['Status', 'Ticker', 'Issuer', 'Shares', 'Value'])
display_holdings_changes(df[df['Status'].str.upper() == 'CLOSED'].copy(), "--- POSITIONS FULLY CLOSED ---", ['Status', 'Ticker', 'Issuer', 'PrevShares'])
display_holdings_changes(df[df['Status'].str.upper().isin(['INCREASED', 'DECREASED'])].copy()
, "--- MODIFIED POSITIONS (INCREASED / DECREASED) ---", ['Status', 'Ticker', 'Issuer', 'PrevShares', 'Shares', 'Value', 'ShareChange', 'ShareChangePct'])
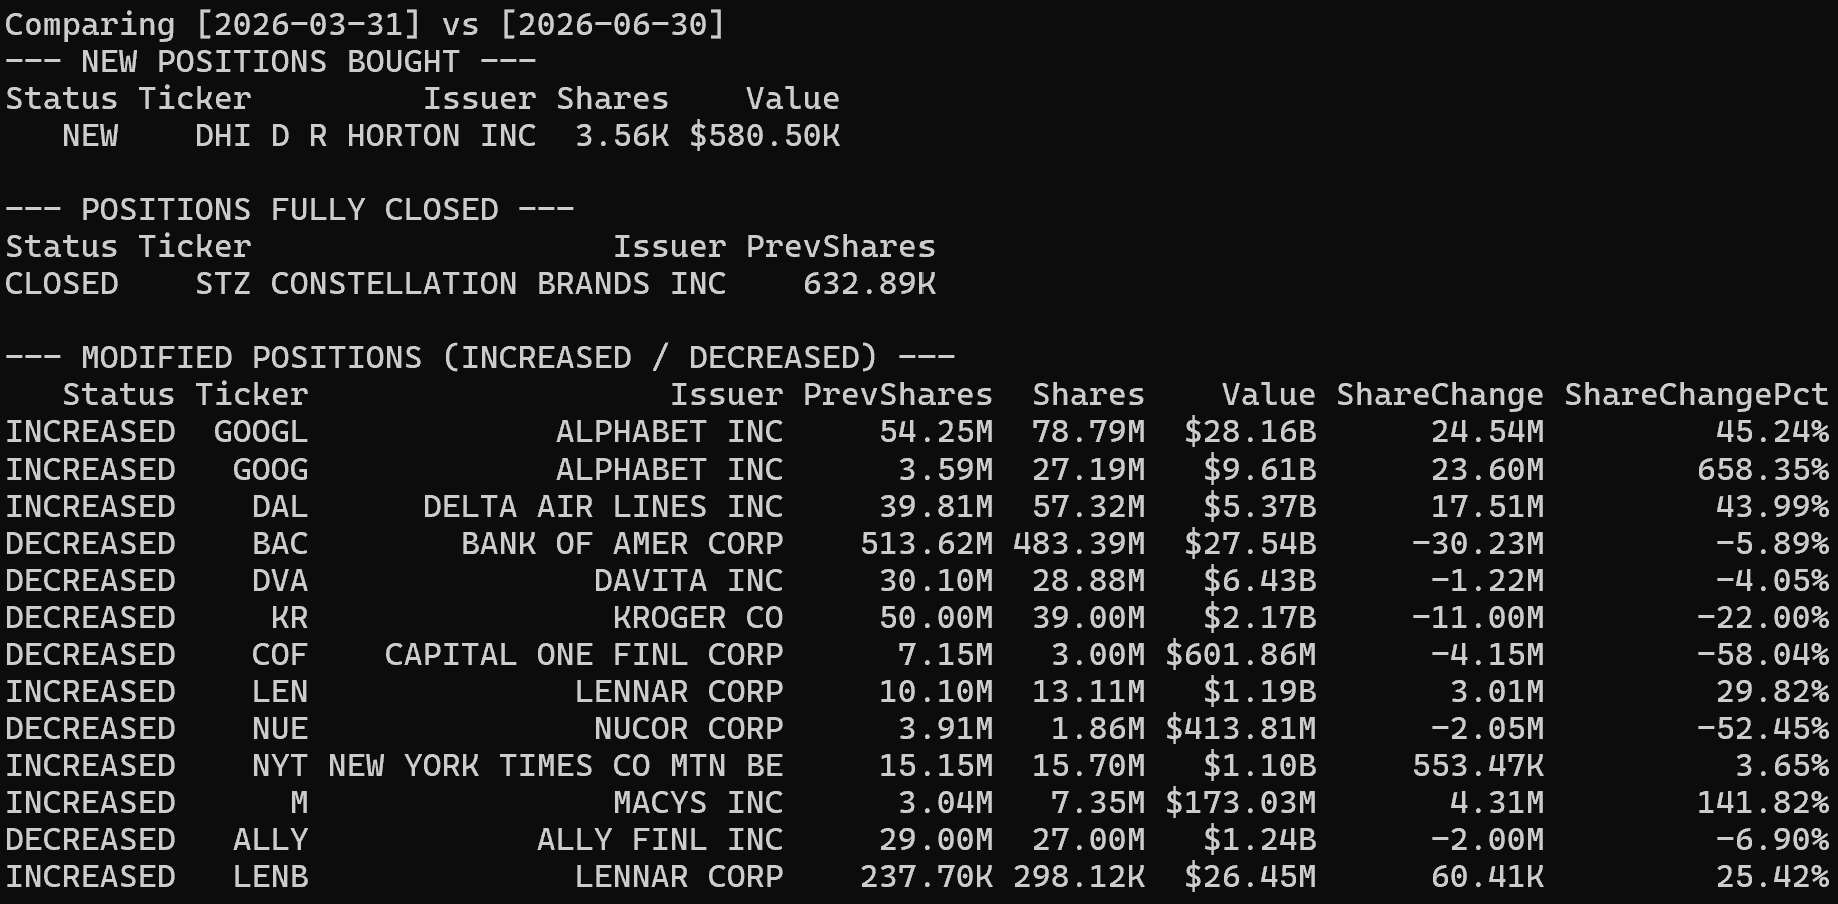
The under 50 lines of code itself is a straightforward data retriever program. It gets the public data from the SEC and executes the comparison. The most important parts are the .get_filings() and .compare_holdings() functions. The .get_filings() retrieves the current and past 13F filings of the company, i.e. it has all the information we need. The .compare_holdings() then compare the difference between 2 filings, allowing us to spotwhat have been bought, sold and modified.
For extra programming context, we use math.log10() in format_human_number function to shorten lengthy numbers(Berkshire Hathaway always makes BIG deals!) into human friendly formats like 10K and 10M. Another feature we use often is the lambda function, so we can apply basic logic like format_human_number and append dollar signs in one single line.
Let's run the problem with uv command:
uv run main.py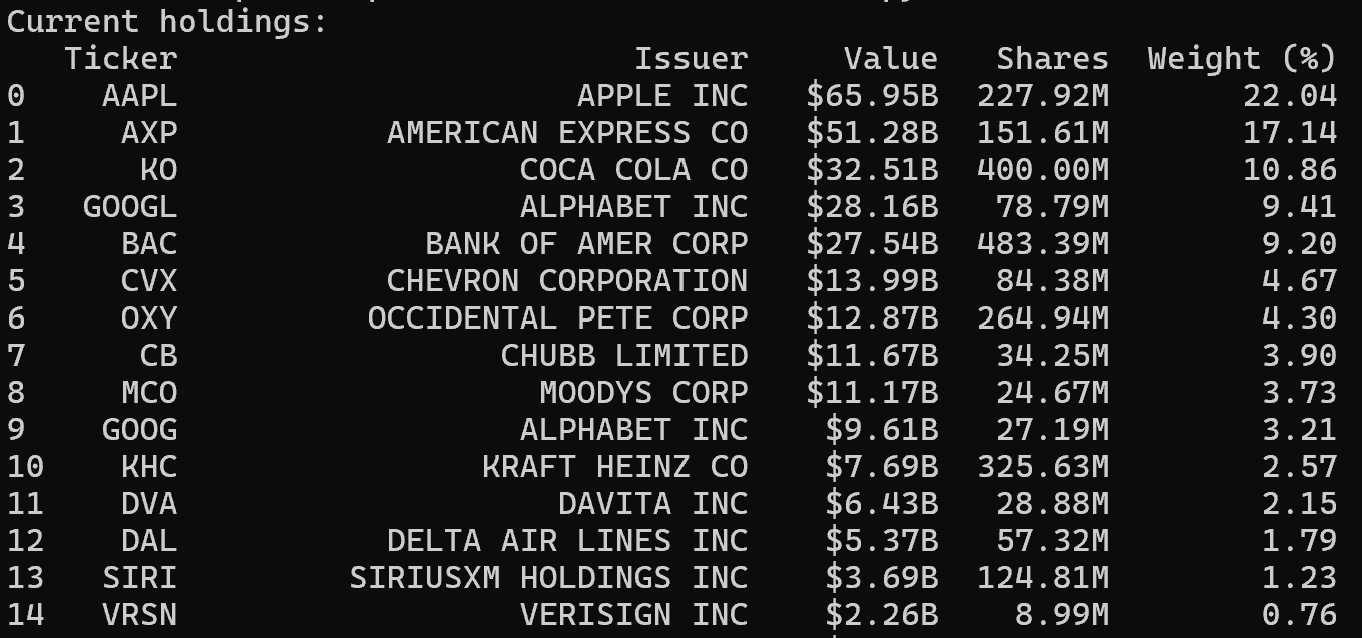
What We Learned (and What to Watch Out For)
The biggest takeaway from this setup is how much it resembles working with distilled image models. When we run a distilled FLUX or Qwen-Image model, we accept a tiny trade-off in fine detail to get a fast, lightweight, and surprisingly decent result. It gives us a solid, dependable B+ result every single time without requiring a massive rig.
Filtering stocks through Berkshire’s 13F works the exact same way. This strategy will never make us an A+ investor, we won't discover the next undiscovered 100x micro-cap before Wall Street does. But does that really matter? For most of us, being a consistent B+ investor is more than enough to build wealth safely and enjoy an easy, low-stress life.
If we try this strategy ourselves, we just need to keep latency in mind. 13F filings are delayed by up to 45 days after the quarter ends, so by the time we see a move, the market has often already reacted. Use this distilled 13F pool as a reliable safety net and starter list, but always perform a quick sanity check on valuations before placing a trade.
So give the script a run, let Berkshire do the heavy lifting, and enjoy the peace of mind that comes with a streamlined portfolio. Happy B+ investing, and let’s keep making the easy, high-value choices!